How many times has this occurred that when you are trying to find some information on the web and you end up on a really big text article explaining it all in a boring way? You might tend to lose interest or worst, you may not get what you were actually looking for. Even in the case of studies, a concept becomes clearer if it has a diagram or a visual figure associated with it, rather than the long text paragraphs. The human brain tends to grasp visual things faster and in a way more efficient manner. Naturally, you would too prefer a visual representation of something more than any other way.
Infographics are an excellent way to create such visual images and diagrams to put a large chunk of information into a smaller, convenient format. Instead of going through all the long paragraphs, you could dive direct into the main thing by creating a good infographic figure. Not to forget the attractiveness it adds to it.
For all the bloggers, out there, infographics are a great way to drive maximum traffic to your blog since these figures tend to attract maximum people. Sure, you could do that using photoshop, but let’s face it, who’s got the amount of time to spend that it requires. Instead, an easy alternative for you can be the various infographics tool available on the internet. Some of them are absolutely free while others may be purchased.
Check out some of the best tools to create stunning infographics below and find your best fit.
12 Impressive Tools to Create Stunning Infographics for Free
Table of Contents
1. Infogr.am
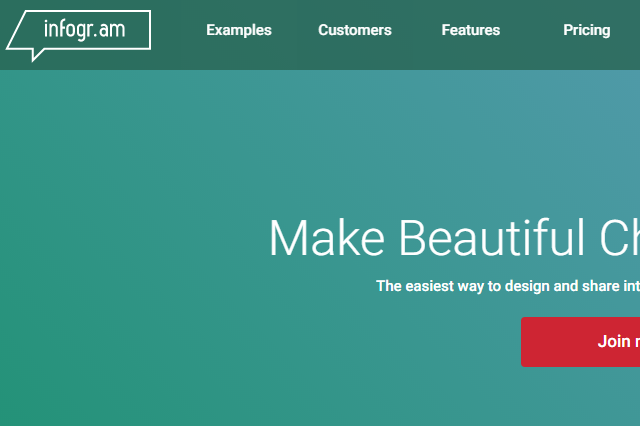
Infographics are all about creating attractive pictures filled with beautiful colors and attractive formats. Infogr.am is one such free online tools that help you do that in the easiest way possible. All you need to do is follow the 3 easy steps. First, you must choose a template from the list of available ones. Secondly, you can visualize your data according to the chosen template and finally, you can publish or share your infographic online. Talking about the nature of available templates, they have been focused on education, brands, media and blogs, and organizations.
Web Link: infogram
2. Desygner
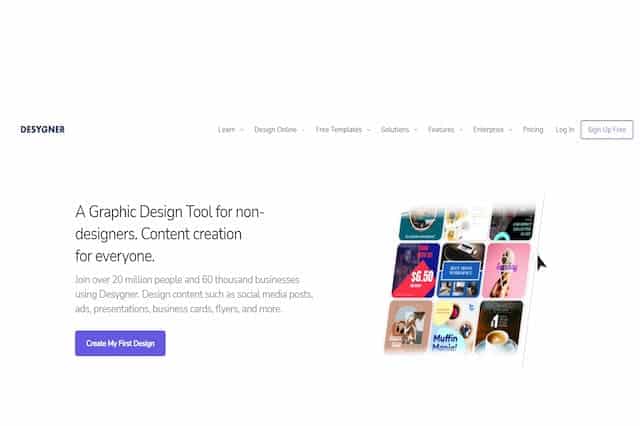
Desygner is a graphic design tool for anyone who needs graphics to market, branding, flyers, posters, invitation cards, banners, infographics and other purposes. This is a great tool for agencies and small businesses who want to save time and effort when creating graphics.
Promoting your services on social media is a great way to promote your brand. This will increase traffic to your site. There are many templates categories that you can choose from, so you can create graphics for any type of project, from digital marketing to birthday invitations.
3. Canva

Another very easy-to-use infographic tool is the Canva. It is basically a browser based application and it the fastest application that would help you come up with great designs and infographic ideas. Not only does the pre-defined templates in this tool are good to go, but it also allows to create your own completely new infographic. For that too, it offers assistance through the already existing elements that you could use according to your data. Once your infographic is ready, you can either save it your hard drive in your desirable image format or you could directly share it online using the editor.
Web Link: Canva
4. Visual.ly
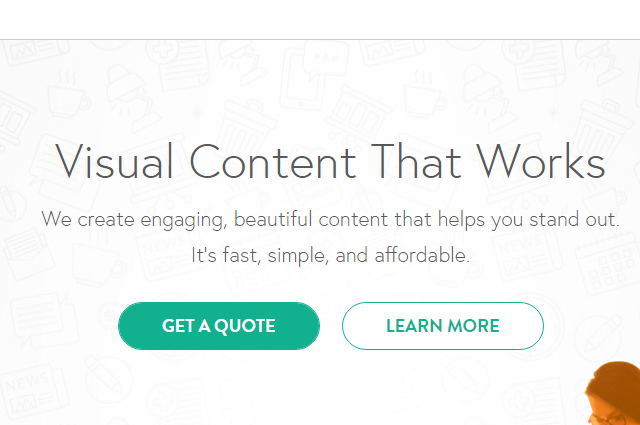
Visual.ly is another very easy to use infographic tool available on the internet. Like others, it also consists of attractive pre-defined templates to choose from. The best thing about Visual.ly is that it has an amazingly user-friendly interface and one can easily create a visual data representation without having any first-hand graphic designing knowledge. This tool is all about visual communication and it is even a community of about 35k designers who visual data pros!
Web link: Visual
5. Stat Planet
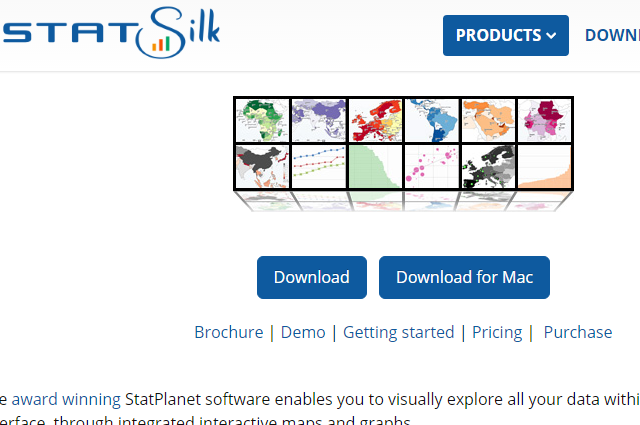
When you want to create some really attractive and interactive visualisations which could then be used as it is or they may be used to create a different static image, you know you can rely upon the Stat Planet. Customising some of the best kind of data into your desirable format is something that is offered by this tool. You can download the complete tool or you can also use it on your browser straight away.
Web Link: Statsilk
6. Vizualize.me

Traditional resumes have become out of style. Who has got that kind of time to go through all the complete text based detailed resume of yours. Why not give the visual effects a shot here too? Vizualize.me is one such tool which comes to your aid in this. Using this one, you can create visually attractive and informative resumes with the help of just a few number of clicks. A great infographic tool to add an oomph! to your classical resume format.
Web Link: Vizualize
7. Venngage
Venngage is a very easy to use and an effective tool to create informative infographics. It is comprised of many pre-defined designs and templates. As is seen, they have been divided into a total of 5 sections namely Reports, Posters, Infographics, Promotions and Social. A number of design options have been included in each of these sections. You can create a report under the reports section or a powerful infographic by customizing your data into the Infographics section.
Web Link: Venngage
8. Google Charts
For putting your data into a visual chart format, the new Google feature Google Chart is the best and the easiest alternative. Being absolutely free of cost, it offers really cool and clever interactive chart designs that you can use to group up a large piece of data. Talking about a variety of designs, the Google Charts has almost each kind of them depending upon the type of data. You can add these charts to your website by following some very easy steps too.
Web Link: Google
9. Easel.ly
Since some of us might be new to infographics, we do require that the tool is easy to use. Easel.ly is one such tool that is extremely easy and very user-friendly. It provides 60 images and 10 types of fonts to choose from which are free. Since it is a web based application, all you need to do is go on their home page and select an infographic. The customizing part shall start right away.
Web Link: Easel
10. Infoactive
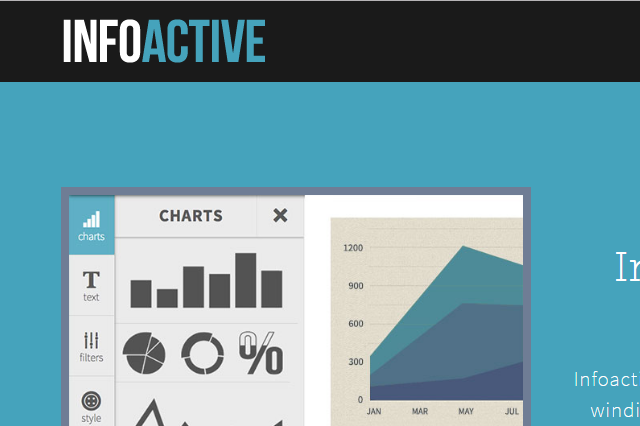
Another great and easy to use web-based infographics tool is the Infoactive. Very easy and informative computer graphics can be made using this tool. You may want to visualise your data into maps, icons, fonts, charts or interactive filters. Infoactive has got it all. Using this tool, you can even embed your infographic directly onto your website or you can download it to your computer.
Web Link: Infoactive
11. Hohli
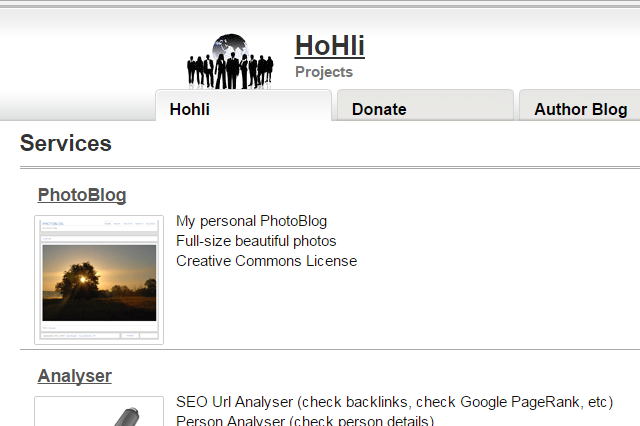
If you are looking for an effective tool which helps you create simple graphics from data, then Hohli might be your catch. Hohli has a lot to offer such as pie charts, bar charts, radar charts, scatter plots or Venn diagrams. By using attractive colors and shapes, you can give a systematic shape to your data using the charts in Hohli. All you need to do is pick up the chart design from the list, add your own data, customise the chart in terms of colours and sizes and you’re done.
Web Link: Hohli
12. Creately
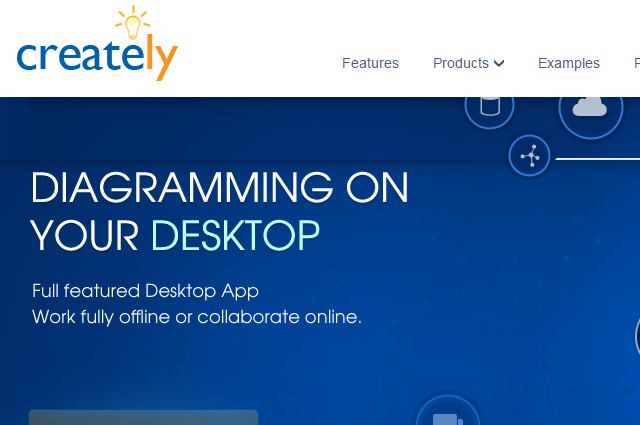
One of the best infographics tools to create informative diagrams and figures is the Creately. You can create easy and attractive flow charts using this tool. A number of pre-designed diagrams have been already included in this application. You can choose the one that you like and then add your own data and make up your own visual diagram. The flow charts made from this tool are very easy to collaborate and embed into your website. Visually, the diagrams and representations look really professional.
Web Link: Creately
There are many other tools that can help you create some cool infographics. Let us know if there is any other tool that you have used before and think should be listed here.